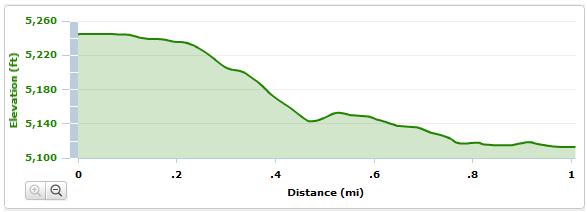
A group of 17 brave trail runners showed up last night for the first Pineridge Downhill Mile. It was windy many were unaccustomed to the rigors of running a hard effort all out mile, but the results were strong and some fastest of all time miles were run.
Here are the results:
--------- 3/31 -- 4/28
Alex A.---- 6:03 --- 5:38
Alex M.-- 5:45 --- 5:54
Brian ---- 7:00 --- 7:00
Cat----- 6:19 --- 6:11
Celeste -- 6:45
Chris H.-- 7:00
Dave ---- 5:08
Erin ----------------- 8:39
James ---- 6:15
Jennifer --------------7:25
Joselyne ---------- 7:01
Mary ---- 6:39 --- 6:39
Matt -------------7:20
Michele -- 8:05
Mindy ---- 7:58
Molly ---- 8:35 --- 8:20
Nick C. ------------- *
Nick M. --- 5:10 --- 4:58
Pablo ---- 6:29 --- 6:13
Pete ----- 5:22 ---- *
Shawn --- 6:35
Slush ---- 5:45 --- 6:20
Below is a scatter plot of last night's mile times vs. Towers PRs. Each point on the graph represents one person who ran last night with their mile time on the x-axis (horizontal) and their Towers PR on the y-axis (vertical). The line is the trend line that shows the average correlation between these two values for this group of people. Only 12 of last night's runners had Towers times and some of the times from last night are estimated due to lack of watch.

Click on the graph to see it full size
If your point falls above the trend line, it means that your mile time is fast proportional to your Towers Time (or you can read it as your Towers time is slow compared to your mile time). A perfect example of this is Nick M. Nick has amazing leg speed on flats and downhills compared to his time on Towers which is still pretty fast.
If your point falls below the trend line, it means your Towers time is fast compared to your mile time (or your mile time is slow). Slush was the perfect example of this last night. Mr. Slusher is a monster on Towers seemingly running faster and faster on each attempt; his mile time last night however was comparably average (hey, he tied with me).
If you look at the point between Nick M. and Scott you find Mr. Consistent himself, Pete, whose data almost defines the trend. What this means is that in relation to the group, Pete is equally strong and fast on both the Towers ascent and the Pineridge Mile.
With only 12 data points and some timing and weather irregularities, this plot is far from perfect, but it does provide an interesting way to assess your strengths and weaknesses in two very different running events.
The next running of the PDM will be Thursday, April 28. Come out and attempt to improve your mile time or set a new personal mile record.